70 Years of Real Estate Appreciation: What the Data Really Tells Ventura County Buyers and Sellers
70 Years of Real Estate Appreciation: What the Data Really Tells Ventura County Buyers and Sellers
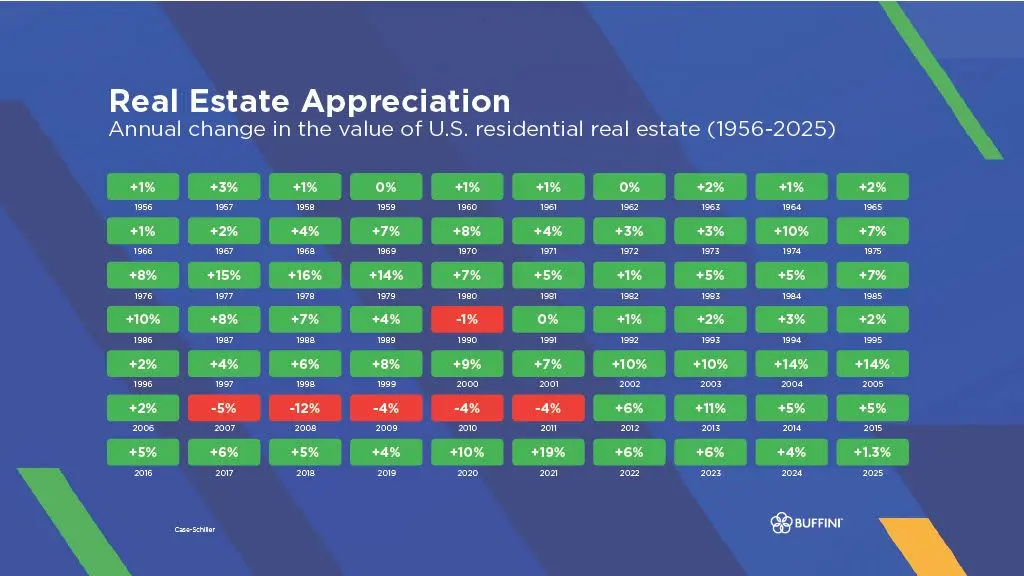
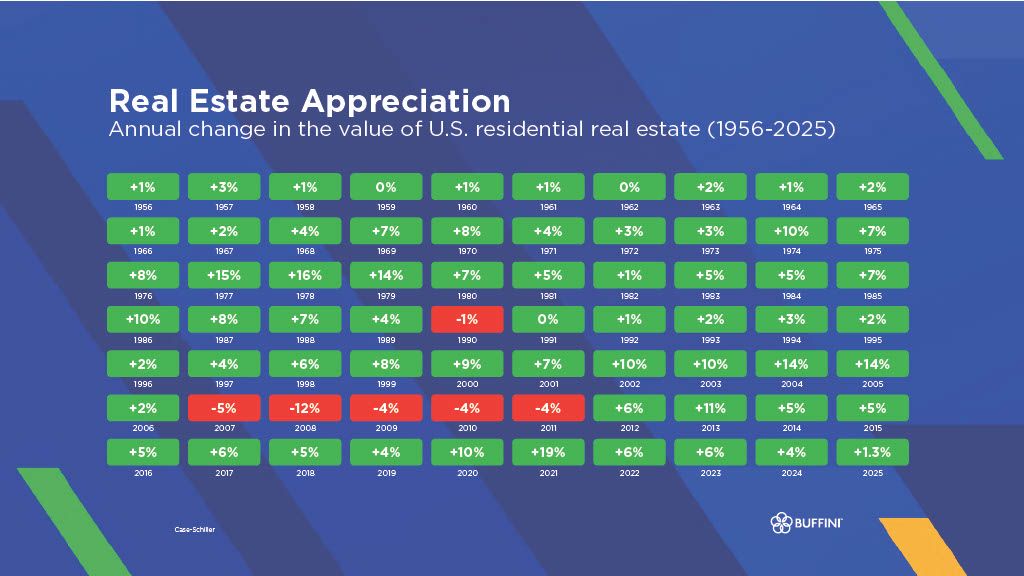
Case-Shiller data going back to 1956 shows just how rare it actually is for U.S. home values to drop.
If you've ever hesitated on a home purchase because you're worried about "buying at the wrong time," there's a chart worth looking at. It tracks U.S. residential real estate appreciation nationwide from 1956 through 2025, using Case-Shiller data, and it tells a clear story about how rarely home values actually go down.
The National Picture: 70 Years, Only 6 Down Years
Out of seven decades of data, national home values declined in exactly six calendar years: 1990, and then the stretch from 2007 to 2011 during the housing crash. Every other year, values were flat or positive, including stretches of double-digit growth in the mid-1970s, late 1970s, and mid-2000s.
That doesn't mean real estate is a straight line up. It moves in cycles, and some years grow faster than others. But the pattern over seven decades leans heavily toward appreciation, not decline.
The Standout Years, Nationally
- Biggest single-year gain: 2021, at +19%, fueled by record-low interest rates and a pandemic-driven rush for space.
- Biggest single-year drop: 2008, at -12%, the worst year of the financial crisis.
- Most recent year, 2025: +1.3%, one of the slower growth years of the last decade, but still positive, not negative.
Decade by Decade, Nationally
| Decade | Pattern |
|---|---|
| 1956-1965 | Slow, steady, mostly 0-3% annually |
| 1966-1975 | Acceleration begins, up to +10% |
| 1976-1985 | Strong growth years, including +15% and +16% |
| 1986-1995 | Mixed, including the only down year before the 2000s (-1% in 1990) |
| 1996-2005 | Sustained climb, up to +14% by the mid-2000s |
| 2006-2015 | The crash years, five straight annual declines (2007-2011), then recovery |
| 2016-2025 | Steady growth, a pandemic-era spike to +19% in 2021, then cooling to +1.3% in 2025 |
So What Does National Data Actually Tell Us About Ventura County?
Everything above is national. It's the big-picture backdrop, not a forecast for any one street or neighborhood. So it's fair to ask: why should a chart about the whole country matter to someone buying or selling here in the 805?
A few reasons. First, national appreciation trends set the tone for mortgage rates, buyer confidence, and how much risk people feel comfortable taking on, and all of that flows down into local decisions. Second, Ventura County has historically tracked the national pattern of "mostly up, rarely down," while also benefiting from its own local supply constraints: coastal geography that limits new construction, strong demand from people relocating from pricier markets like Los Angeles and the Bay Area, and desirable school districts across Camarillo, Ventura, and the surrounding areas. Those local factors have tended to help Ventura County hold up at least as well as the national average, even in slower years like 2025.
None of this means every property in the 805 moves in lockstep with the national number. Local supply, specific neighborhoods, and individual home condition still matter a lot. But the national chart gives useful context: it shows that sustained, multi-year price drops are rare and usually tied to major economic shocks, not the normal course of things. That's worth remembering if you're a seller sitting on equity built up over years, or a buyer trying to time the "perfect" moment. Trying to perfectly time a market that has only dropped six times in 70 years, nationally, is a tough bet to win.
Frequently Asked Questions
Has U.S. home value ever actually gone down?
Yes, but rarely. Case-Shiller data going back to 1956 shows only six years of nationwide decline in 70 years: 1990, and then 2007 through 2011 during the housing crash. Every other year saw flat or positive appreciation.
What was the biggest single-year home value increase since 1956?
2021 saw the largest jump on record in this dataset, with U.S. residential real estate values rising 19% in a single year, driven by historically low interest rates and a pandemic-era rush for space.
How much did home values grow in 2025?
2025 appreciation came in at roughly 1.3% nationally, one of the slowest growth years of the past decade, though still positive. It reflects a market that has cooled from the pandemic-era surge but has not turned negative.
Is now a bad time to buy a home because prices might drop?
Seventy years of data shows sustained multi-year national price drops are rare, historically tied to major economic shocks like 2008. Short-term timing is hard to predict, but long-term ownership has consistently trended upward. A local real estate professional can help evaluate current conditions in a specific market like Ventura County.
What does national real estate appreciation data mean for Ventura County home values?
National figures set the broader trend, but Ventura County's coastal supply constraints, desirable school districts, and limited new construction have historically made local appreciation patterns compare favorably to the national average over the long run.
Rick Uttich and Dawn Knowles bring more than 50 years of combined real estate experience to helping 805 buyers and sellers make sense of the market.
Categories
Recent Posts